ElevenLabs's case study

Jack McDermott, Growth TeamRead the case“RevenueCat’s analytics give us that opinionated layer with mobile‑native views on trials, renewals, and churn that would take real analytics effort to rebuild accurately on our own.”
Charts
Unified cross-platform analytics that you can filter, cohort and export to get the insights you need to drive your app business.
RevenueCat is trusted by over 121,000 apps
Jack McDermott, Growth TeamRead the case“RevenueCat’s analytics give us that opinionated layer with mobile‑native views on trials, renewals, and churn that would take real analytics effort to rebuild accurately on our own.”
Your source of truth for revenue data across subscriptions, one-time purchases, and even your in-app advertising.
Visualize powerful monetization metrics, including:
Understand the source and volume of new users, dig into the drivers and performance of paid growth campaigns.
Flexibly group customers and measure performance across different metrics over time. Leverage predictive analytics to understand the anticipated pay-back period of your campaign cohorts.
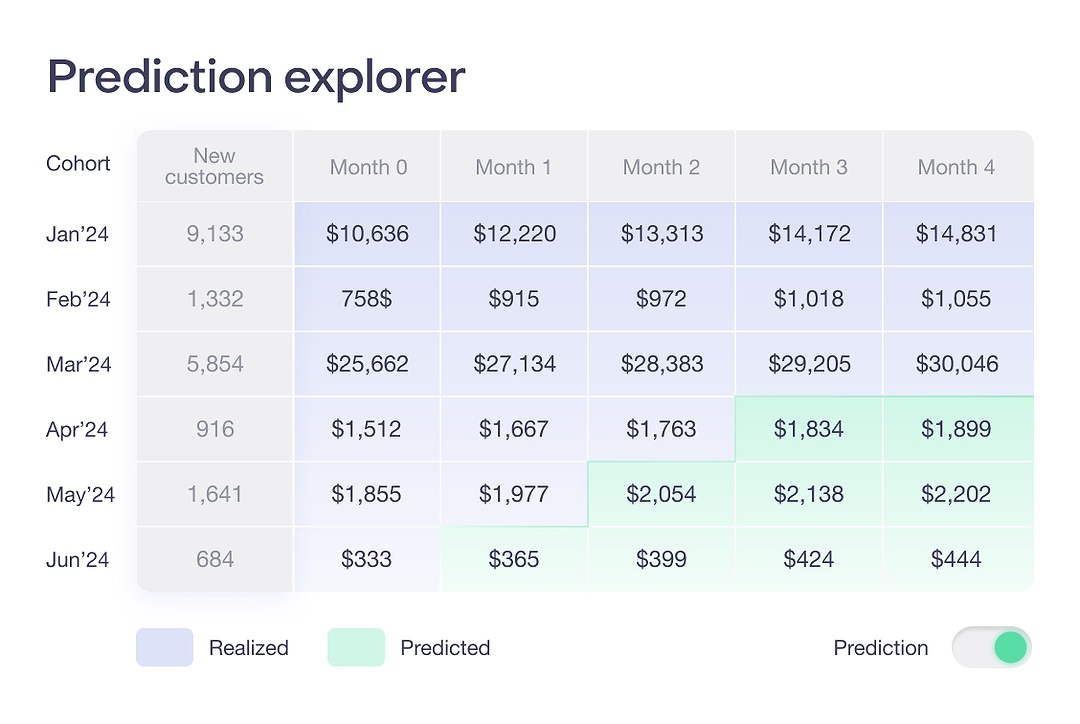
Get a view of how monetization develops over time across all acquired users, highly useful for measuring Return on Ad Spend (ROAS) and CAC payback time.

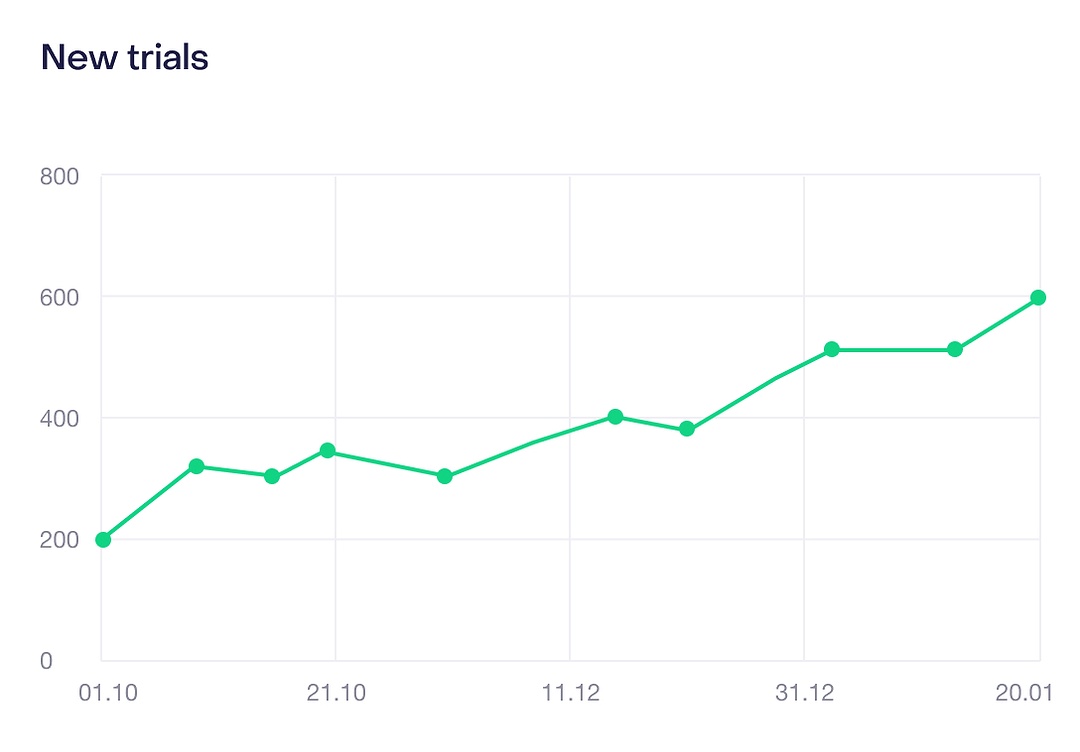
Track volume in this key top of funnel metric, and segment it by dimensions like Apple Search ad campaigns, customer segments and more to see what drives performance.
Drill into what drives users to pay you and then do more of it.
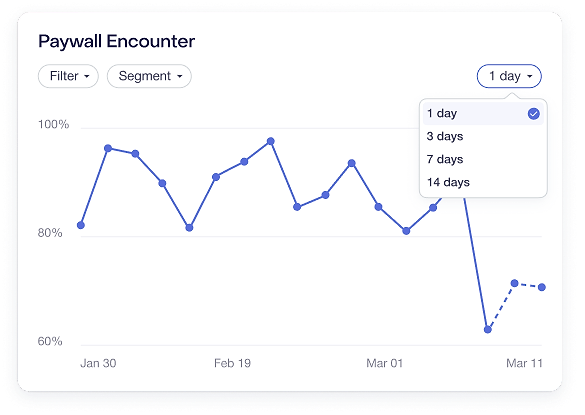
See the percentage of new customers that encounter a paywall within their first days. Pair with conversion charts to separate paywall exposure problems from paywall effectiveness problems.
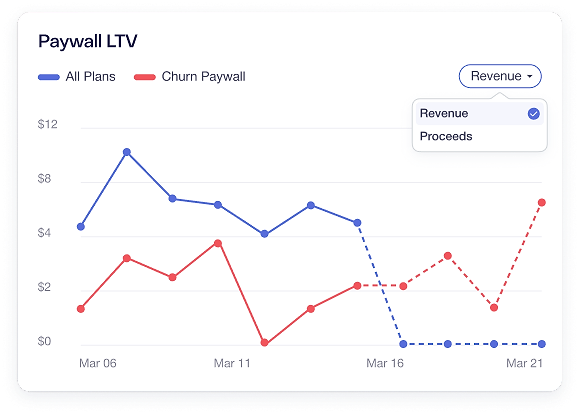
Realized revenue generated per paywall viewer from customers who converted within 3 days of their first impression. Compare paywalls by bottom-line value, not just conversion rate.
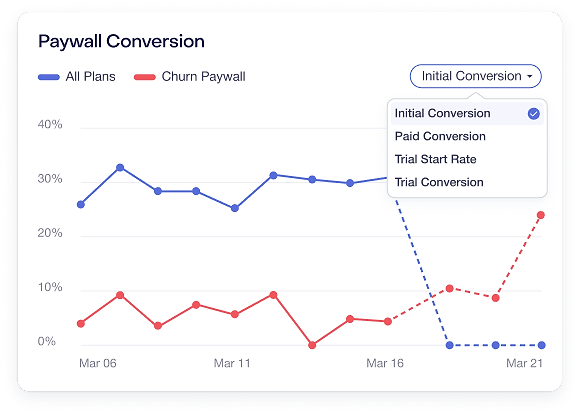
The percentage of paywall viewers convert within 3 days, across initial conversion, paid conversion, trial starts, and trial conversion. Compare paywalls to find which designs and offers drive the most conversions.
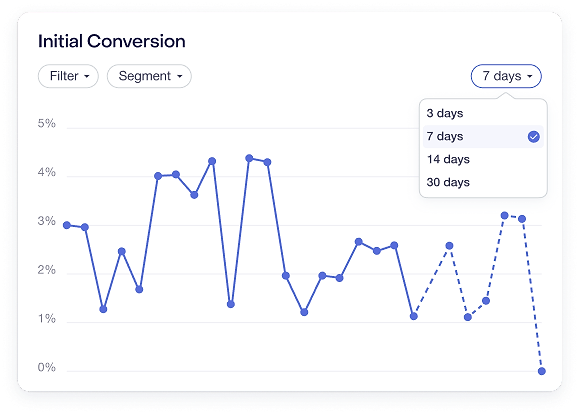
Percentage new customers make any purchase or start a trial, cohorted by first seen date. A top-level signal of how well your app and paywall turn new users into engaged customers.
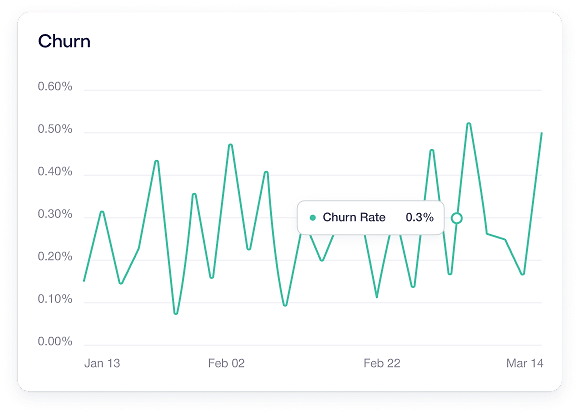
You worked hard to monetize your users. Leverage insight to keep them around.
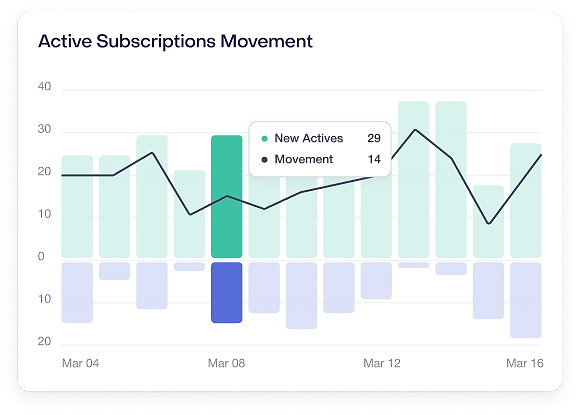
The change in unique paid subscriptions over a period, breaking down what caused the change in the active count.
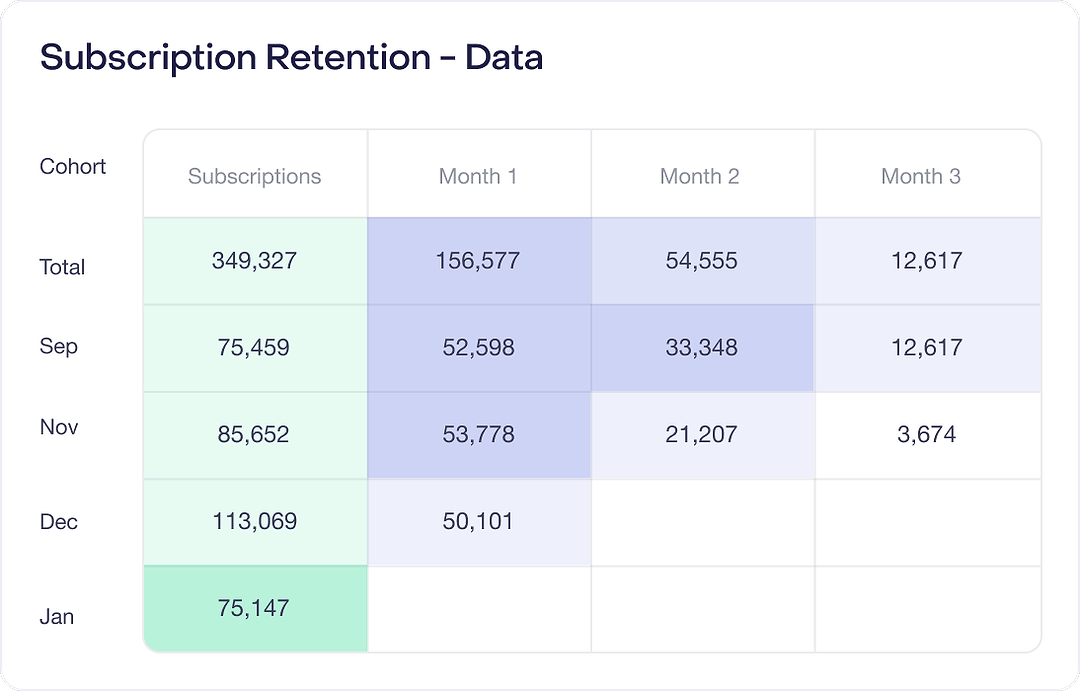
How paying subscriptions renew and retain over time by cohorts, typically segmented by start date.
The percentage of active subscriptions that were lost during a given period and have not yet resubscribed.
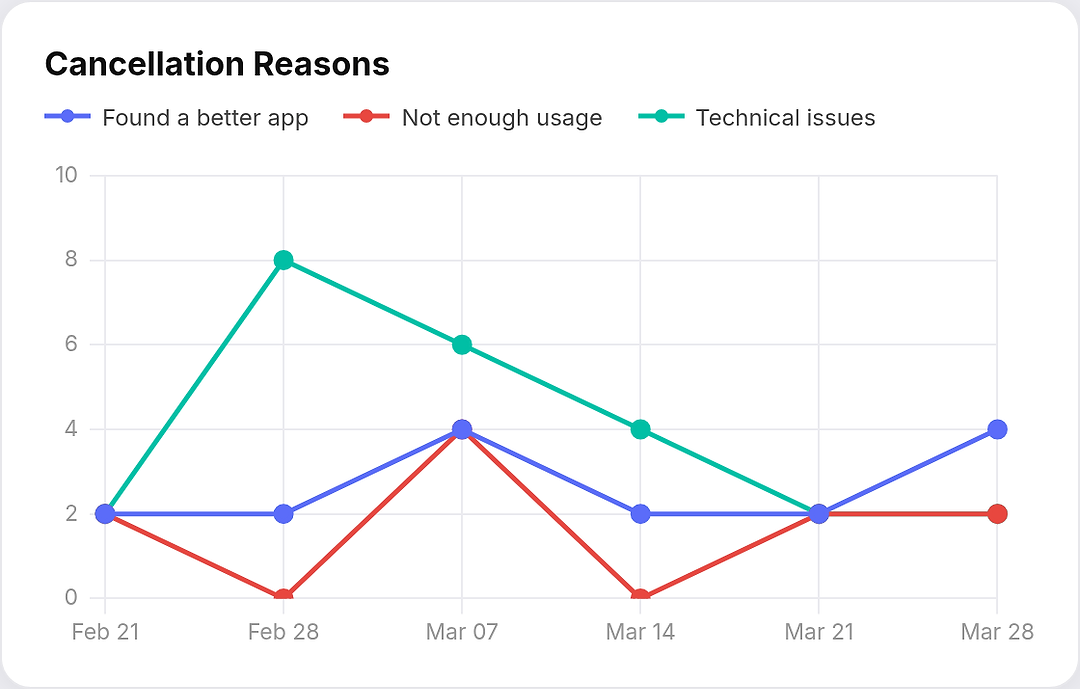
Breaks down survey responses from customers interacting with the Customer Center regarding cancellations or refunds.
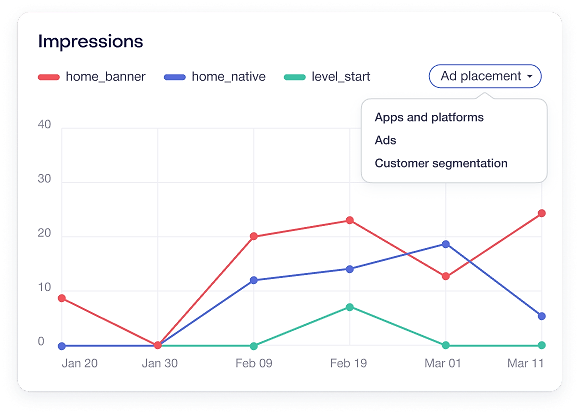
Get the full picture on your monetization, including revenue and metrics for your in-app advertising.
Track the total number of times ads were displayed to users in your app.
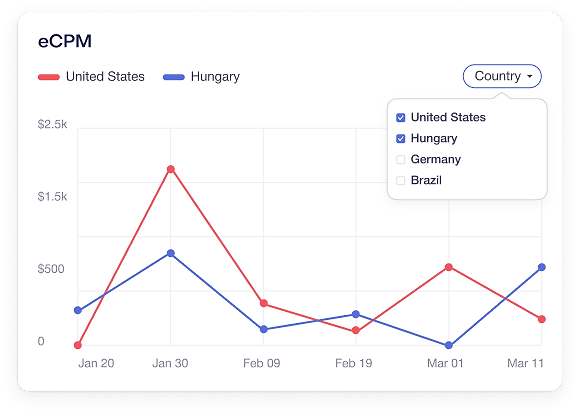
Compare monetization efficiency across different time periods, countries, or platforms regardless of total impression volume.
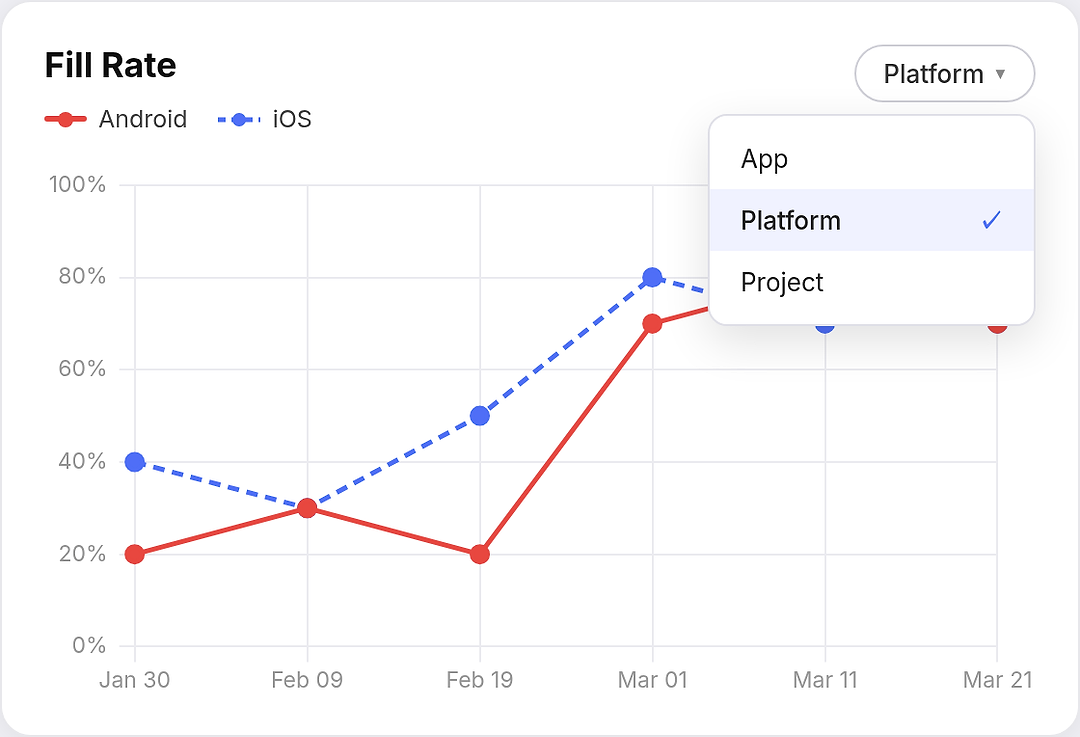
Fill rate shows how successfully ad requests are being fulfilled with actual ads, letting you keep an eye on targeting issues or limited ad inventory.
Track the number of times users clicked on ads in your app. Clicks indicate user engagement with ads and can help you understand which ad placements and formats are most effective.
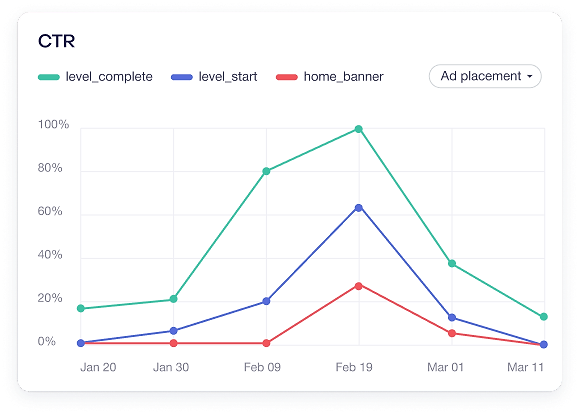
Click-through rate (CTR) measures how often users click on ads after seeing them. A higher CTR indicates your ads are relevant and engaging to users.
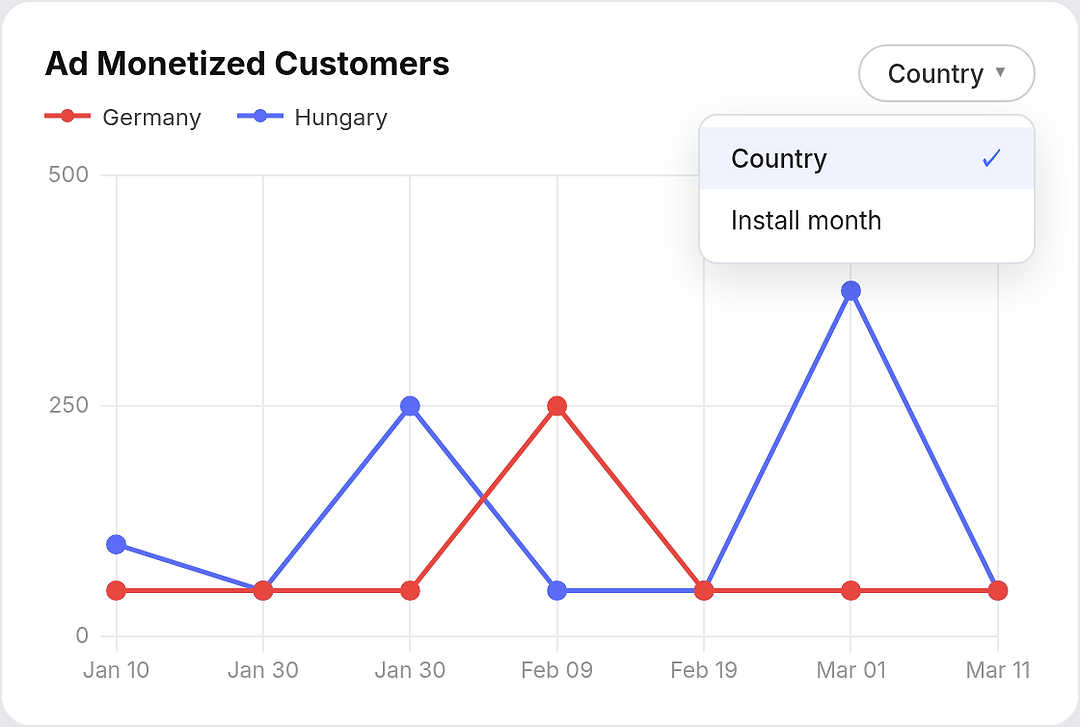
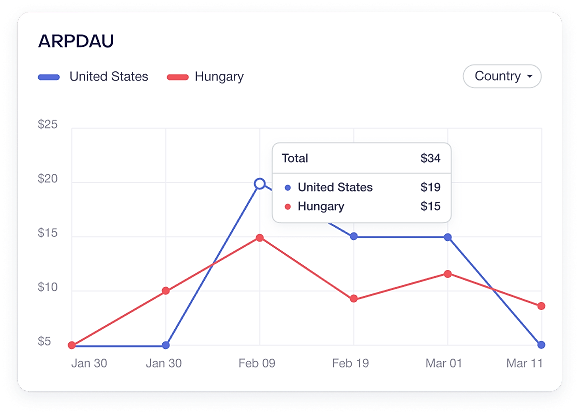
Average Revenue Per Daily Active User (ARPDAU) measures the average ad revenue generated per ad-monetized user per day. Calculated as total ad revenue divided by the number of unique users who viewed ads in each period.
Views that help you keep the finger on the pulse of your app business.
Save your custom filters, segmentation and data views so your team can keep an eye on what matters to you.
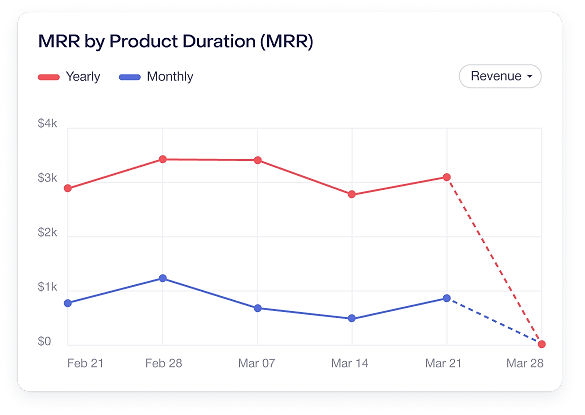
Track the velocity of your business. See how new subscriptions and churned subscriptions affect your MRR.

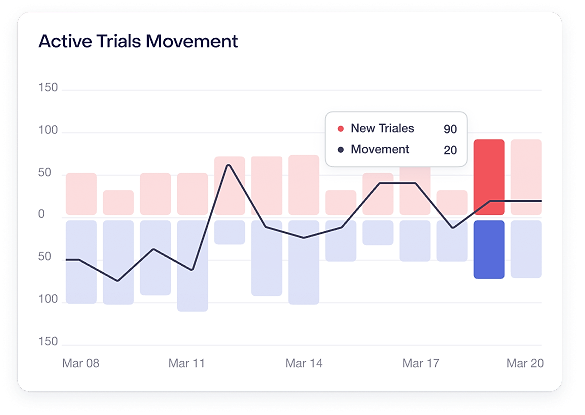
Understand underlying reasons for changes in active trial trends, such as increases from new trials or decreases from conversions/expirations.
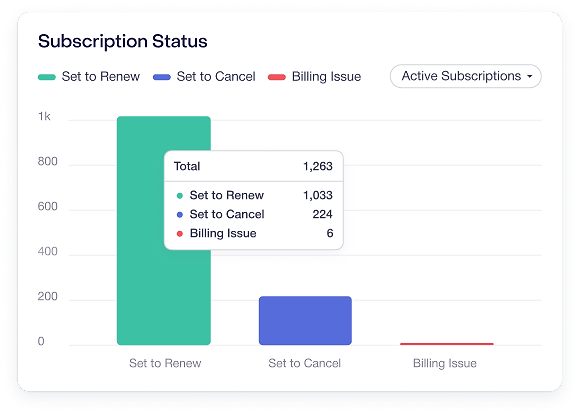
Monitor the future outlook of the active base, showing what portion of subscriptions are healthy versus those at risk of churning.
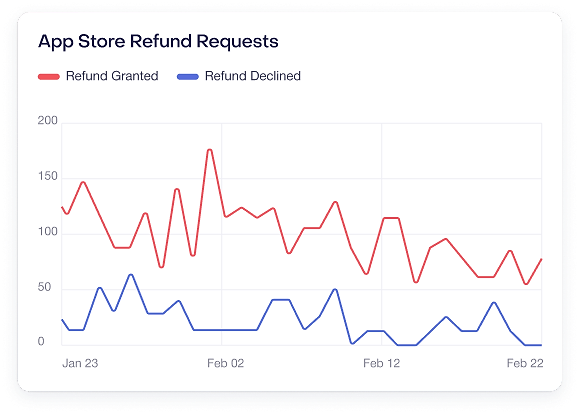
See how many refund requests were granted, declined, or unresolved. Analyze trends to understand drivers.
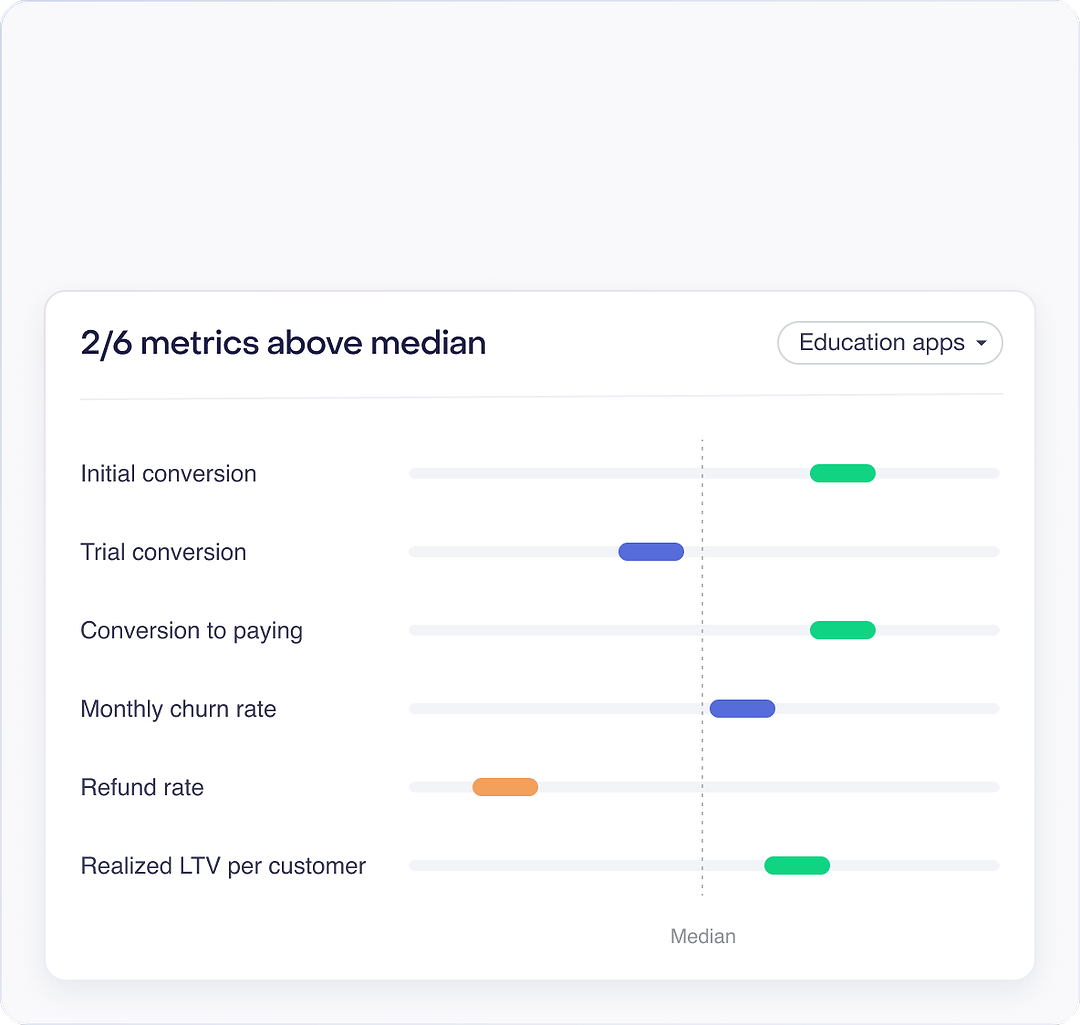
Compare subscription metrics against percentile benchmarks for similar apps so you can quickly see where conversion, churn, and retention are outperforming or lagging.
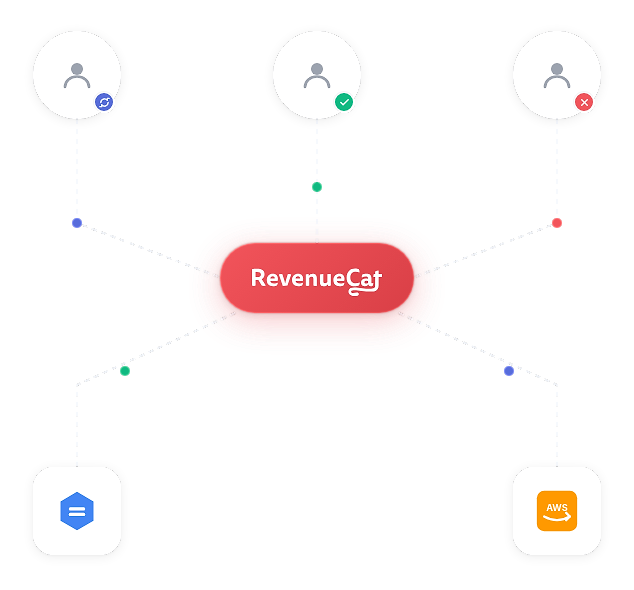
Data can be exported as a CSV and delivered daily to your cloud storage provider. And if Charts isn’t enough, the REST API gives you programmatic access to the same underlying data so you can pipe it into any BI tool or data warehouse you already use.
Our entire suite of features comes standard and it's free to get started.